 |
Weather Eye with John Maunder |
Each month Professor Ole Humlum of the The University Centre in Svalbard (UNIS), in Norway publishes on his very comprehensive web site a large number of updated charts and related analyses of data from international sources.
His latest website can be found at: www.climate4you
Record of recent global air changes in air temperatures.
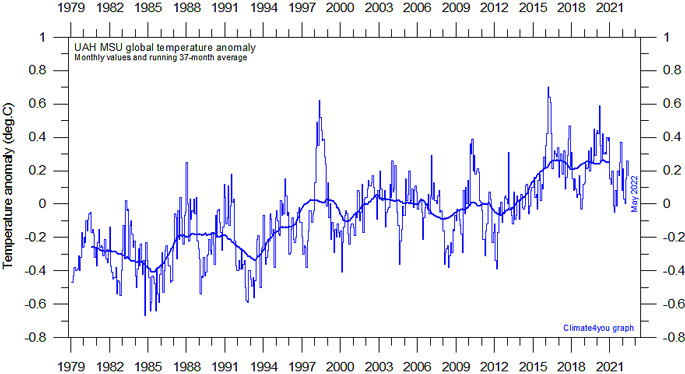
Global monthly average lower troposphere temperature since 1979 according to University of Alabama at Huntsville (UAH), USA.

This graph uses data obtained by the National Oceanographic and Atmospheric Administration (NOAA) TIROS-N satellite, interpreted by Dr. Roy Spencer and Dr. John Christy, both at Global Hydrology and Climate Center, University of Alabama at Huntsville, USA. The thick line is the simple running 37 month average, nearly corresponding to a running 3 yr average. The cooling and warming periods directly influenced by the 1991 Mt. Pinatubo volcanic eruption and the 1998 El Niño, respectively, are clearly visible. Reference period 1991-2020. Last month shown: May 2022. Last diagram update: 7 June 2022.
***************************************

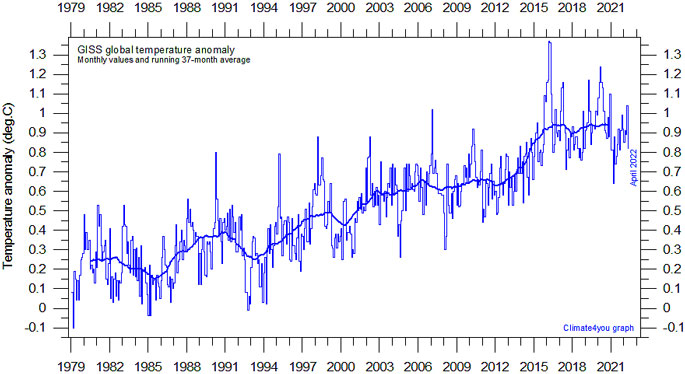
Global monthly average surface air temperature since 1979 according to the Goddard Institute for Space Studies (GISS), at Columbia University, New York City, USA. GISS is a laboratory of the Earth-Sun Exploration Division of NASA's Goddard Space Flight Center and a unit of the Columbia University Earth Institute. The thick line is the simple running 37 month average, nearly corresponding to a running 3 yr average. Discussions of reasons why the GISS temperature estimate differs from other estimates can be read by clicking here, here and here. Base period: 1951-1980. Last month shown: April 2022. Last diagram update: 21 May 2022.
******************
For further information on a range of weather and climate matters see my recent book "Fifteen shades of climate... the fall of the weather dice and the butterfly effect". Available from Amazon.
**************************************

