 |
Weather Eye with |
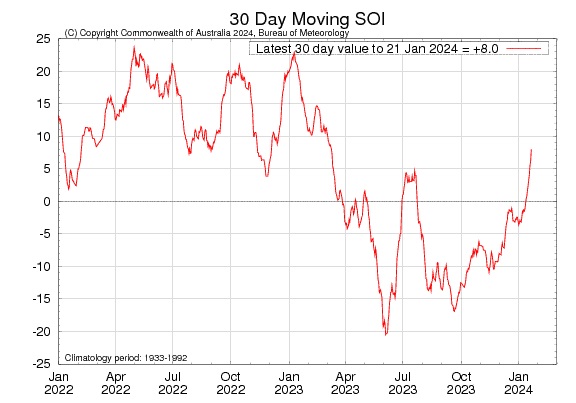
The Southern Oscillation Index, or SOI, gives an indication of the development and intensity of El Niño or La Niña events in the Pacific Ocean. The SOI is calculated using the pressure differences between Tahiti and Darwin.
Sustained negative values of the SOI lower than −7 often indicate El Niño episodes. These negative values are usually accompanied by sustained warming of the central and eastern tropical Pacific Ocean, a decrease in the strength of the Pacific Trade Winds, and a reduction in winter and spring rainfall over much of eastern Australia and the Top End.
Sustainted positive values of the SOI greater than +7 are typical of a La Niña episode. They are associated with stronger Pacific trade winds and warmer sea temperatures to the north of Australia. Waters in the central and eastern tropical Pacific Ocean become cooler during this time. Together these give an increased probability that eastern and northern Australia will be wetter than normal.
Technical details
There are a few different methods for calculating the SOI. The method used by the Australian Bureau of Meteorology is the Troup SOI which is the standardised anomaly of the Mean Sea Level Pressure difference between Tahiti and Darwin. The base period used in the SOI calculation is 60 years (1933–1992).
Calculation:
		             [ Pdiff − Pdiffav ]
		    SOI = 10 -------------------
		                  SD(Pdiff)
where: Pdiff = (average Tahiti MSLP for the month) − (average Darwin MSLP for the month), Pdiffav = long term average of Pdiff for the month in question, and SD(Pdiff) = long term standard deviation of Pdiff for the month in question.
The multiplication by 10 is a convention. Using this convention, the SOI ranges from about –35 to about +35, and the value of the SOI can be quoted as a whole number. The SOI is usually computed on a monthly basis, with values over longer periods such a year being sometimes used. Daily or weekly values of the SOI do not convey much in the way of useful information about the current state of the climate, and accordingly the Bureau of Meteorology does not issue them. Daily values in particular can fluctuate markedly because of daily weather patterns, and should not be used for climate purposes.

Graph supplied.

