 |
Weather Eye with |
The climate4you.com website developed by Professor Ole Humlum who is a Danish Professor Emeritus of Physical Geography at the University of Oslo, and Adjunct Professor of Physical Geography at the University Centre in Svalbard.
The website climate4you.com which he edits endeavours to provide an ongoing climate data website which is updated monthly.

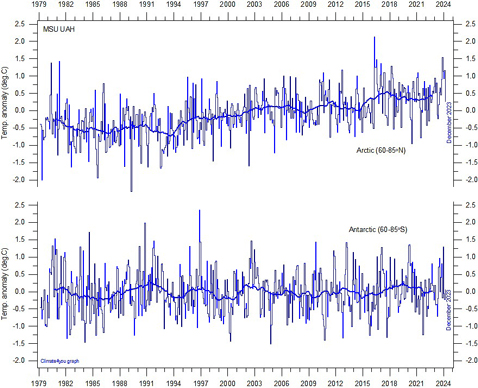
Recent temperature changes in the two polar regions.
The above diagrams show changes of average temperatures only. To enable a more detailed analysis of recent spatial surface air temperature changes in the two polar and adjoining regions, you will find two tables below, representing areas north of 50oN and south of 50oS, respectively.
In these tables recent monthly surface air temperatures are compared with the average temperature for the period 1998-2006, to monitor any general recent change of temperature, up or down.
As mentioned above, global climate models forecast that surface air temperatures should increase rapidly now and in the future due to increasing atmospheric CO2, especially in the two polar regions.
Click on one of the small maps, and a larger map in polar projection will open in a new window, showing the temperature difference between the month chosen and the monthly average for the reference period 1998-2006.
Geographical regions with higher temperatures the month chosen are indicated by warm colours, regions with lower temperature with blue colours on the scale (degrees C) to the right in the diagrams.
The number in the lowermost left corner represents the temperature deviation for the month shown relative to the average 1998-2006.
The time series of these monthly values are shown in the diagram below each table.
For further Infomation about a wide range of weather/climate matters see my new book "Climate Change ... A Realistic Perspective The fall of the weather dice and the butterfly effect". Google "Amazon"

