 |
Weather Eye with John Maunder |
For further Infomation about a wide range of weather/climate matters see my new book "Fifteen shades of climate... the fall of the weather dice and the butterfly effect".
The extract below on "Central England Temperatures 1700-2018' is from pages 177-179 of my book.
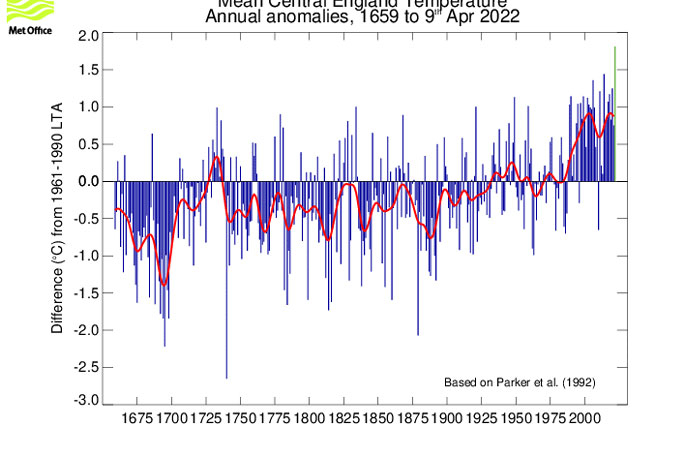
Yearly mean temperatures have been recorded in Central England since about 1700. It is the longest temperature series in the world derived from instrumental records. It shows an increase in temperature of approximately 1.3°C from the end of the 17th Century to the end of the 20th Century/beginning of 21st Century.
Subtle differences in timing between the warming/cooling phases between the Central England record and the other localities may reflect local climate variation, but the similarity in events between continents suggests the Central England Temperature record is recording global temperature patterns.
Records of sunspot numbers began in 1610 such that detailed estimates of solar variation for the years covered by the England temperature record can be made without resort to the use of proxy data.
Reconstructions of total solar radiance (TSR) differ in magnitude, but there is agreement in form with 4 peaks and 4 to 6 troughs occurring over the time-scale of the England temperature record. These are: a minimum in TSR associated with the Maunder Sunspot Minimum in the latter half of the 17th Century; a peak, possibly bi-modal approaching modern TSR values during the 18th Century; a well-defined trough corresponding with the Dalton Sunspot Minimum between 1800-1820; a poorly defined TSR peak in the mid 19th Century; a reduction in TSR during the late 19th Century; increasing TSR during the early 20th Century; a decrease in TSR from around 1950-1975; and a second phase of TSR increase in the late 20th Century.
Source: Alan D Smith; An Analysis of Climate Forcing's from the Central England Temperature Record. British Journal of Environment & Climate Change 7(2): 113-118, 201
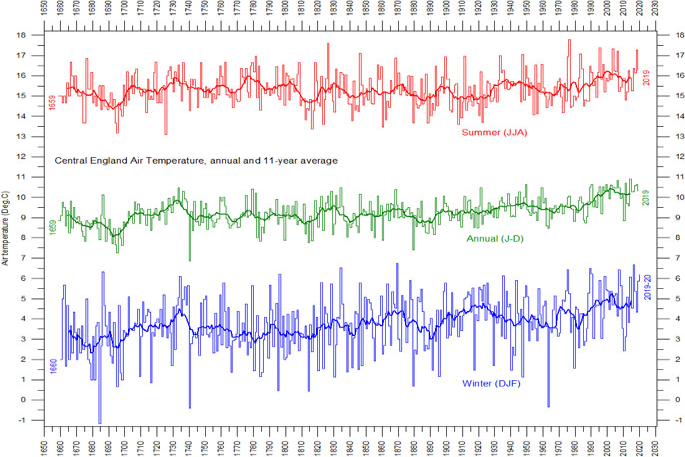
The graph below shows the Central England temperatures for summer, winter , and the year from the period 1650 to 2019.

The Central England surface air temperature series is the longest existing meteorological record. Thin lines = annual values. Thick lines = running 11 yr average. The above graphs for annual, summer and winter temperatures have been prepared using the composite monthly meteorological series originally painstakingly homogenized and published by the late professor Gordon Manley (1974). The data series is now being updated by the Hadley Centre and can be downloaded from there by clicking here (several options) or here (the data shown above). Last diagram update: 10 March 2020. Source Climate4you
**********************
There is good correspondence with TSR throughout the England temperature record, with warm events correlating with high TSR and cool phases correlating with plateaus or decreases in TSR. However, for temperature increases from the beginning of the Industrial Revolution (Maunder Minimum and Dalton Minimum to the end of 20th Century), high TSR models can account for only 63-67% of the temperature increase. This would suggest that one third of Global Warming/Climate Change can be attributed to anthropogenic global warming.
Approximately two-thirds (0.8°C to 0.9°C) of climate warming since the mid-late 18th Century (1.3°C) can be attributed to solar causes, suggesting warming due to anthropogenic causes over the last two centuries is 0.4 to 0.5°C.
As noted, the Central England surface air temperature series (below) is the longest existing meteorological record. (Thin lines are the annual values, the thick lines are the running 11 year average). The graphs for annual, summer and winter temperatures have been prepared using the composite monthly meteorological series originally painstakingly homogenized and published by the late Professor Gordon Manley (1974). The data series is now updated by the Hadley Centre. (see below)
********************************
Hadley Centre Central England Temperature (HadCET) dataset
The CET dataset is the longest instrumental record of temperature in the world. The mean, minimum and maximum datasets are updated monthly, with data for a month usually available by the 3rd of the next month. A provisional CET value for the current month is calculated on a daily basis. The mean daily data series begins in 1772 and the mean monthly data in 1659. Mean maximum and minimum daily and monthly data are also available, beginning in 1878.
Brief description of the data
These daily and monthly temperatures are representative of a roughly triangular area of the United Kingdom enclosed by Lancashire, London and Bristol. The monthly series, which begins in 1659, is the longest available instrumental record of temperature in the world. The daily mean-temperature series begins in 1772. Manley (1953, 1974) compiled most of the monthly series, covering 1659 to 1973. These data were updated to 1991 by Parker et al (1992), who also calculated the daily series. Both series are now kept up to date by the Climate Data Monitoring section of the Hadley Centre, Met Office. Since 1974 the data have been adjusted to allow for urban warming: currently a correction of -0.2 °C is applied to mean temperatures.
This version of CET will be superseded by CETv2 by mid-2022. This will be a fully traceable system, with improved homogenisation and data adjustments to ensure a more consistent data-set through history and up to the present day. Further details to follow in due course.


